Reports
Percentage mix of items and categories in total sales.
In FoodEase Office: Open this page
Highlights which items and categories contribute most to revenue as a share of total sales.
You can also open it directly: Sales Mix Summary in Office.
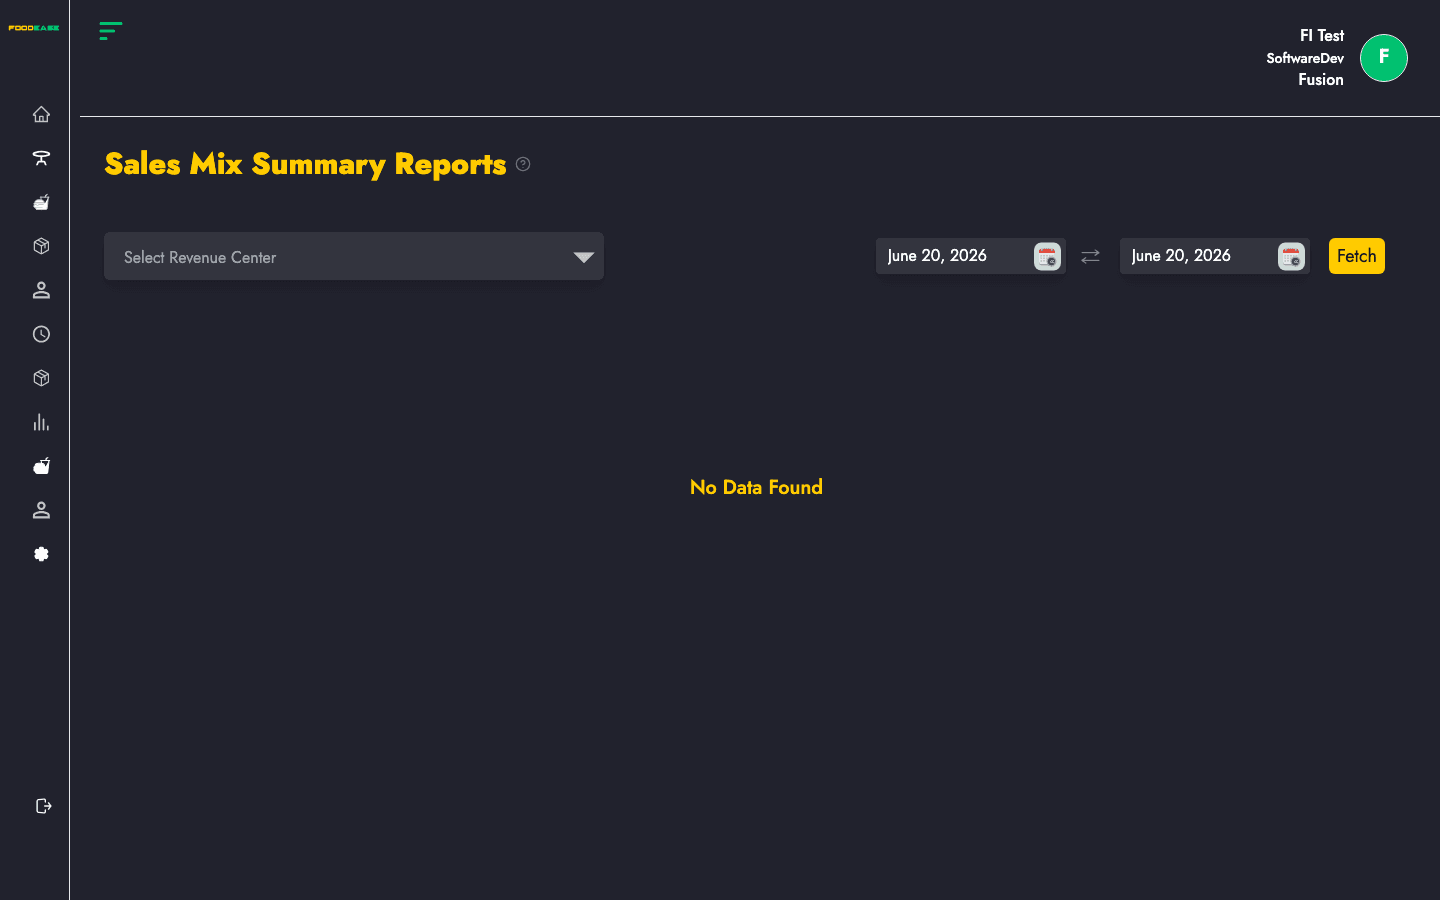
Most reports share the same controls at the top of the page:
| Control | Purpose |
|---|---|
| Date range | Set Date From and Date To, then apply the filter to load data |
| Revenue centre | Optional — limit results to one outlet; leave blank for all centres |
| Print / Export | Use the header actions to print or download (PDF/Excel where available) |
After you set filters, the table or chart refreshes with data for that period.
Highlights which items and categories contribute most to revenue as a share of total sales.